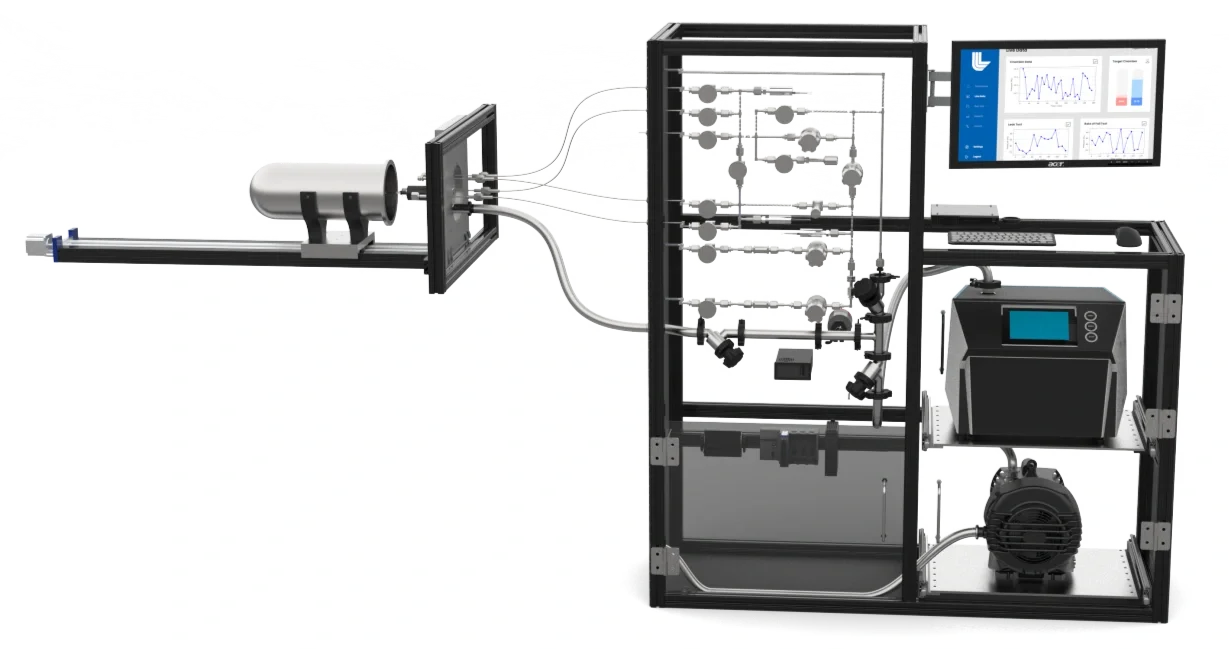
Target Pressure Testing Station
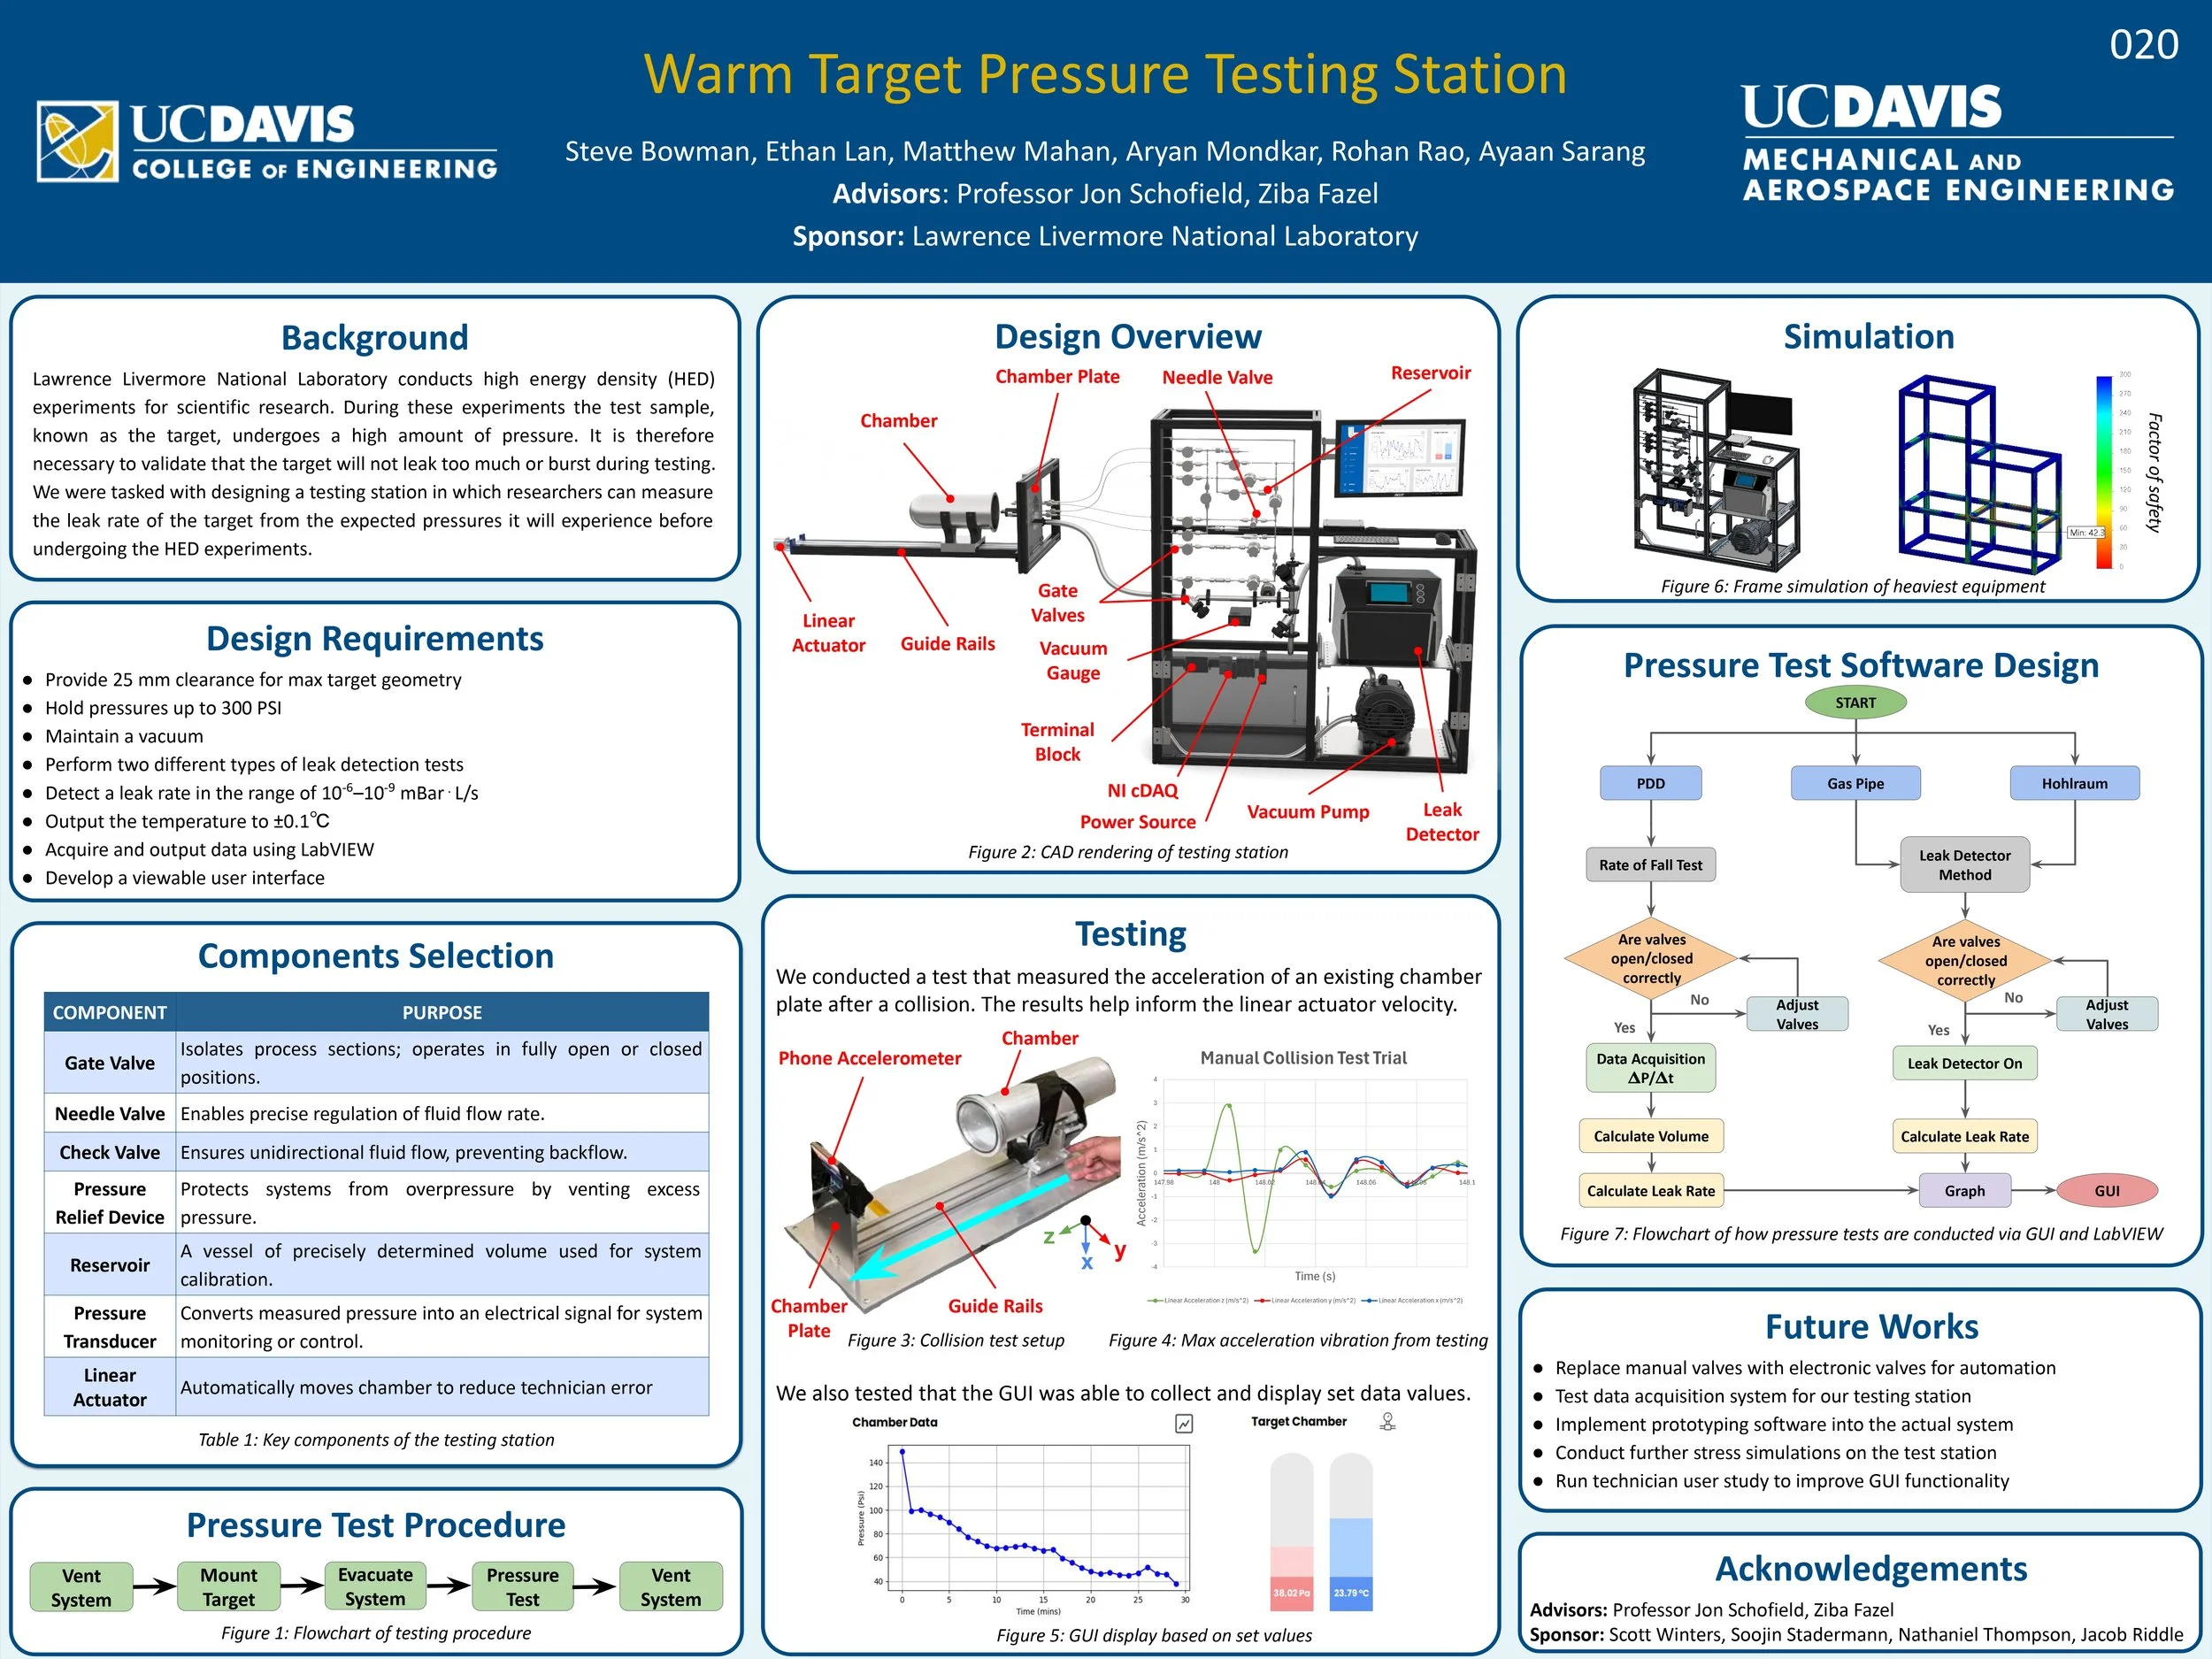
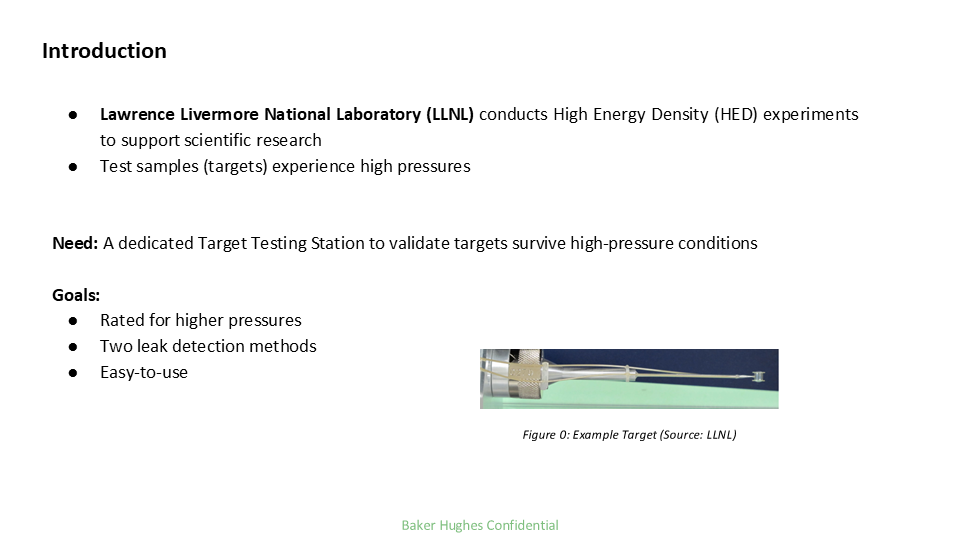
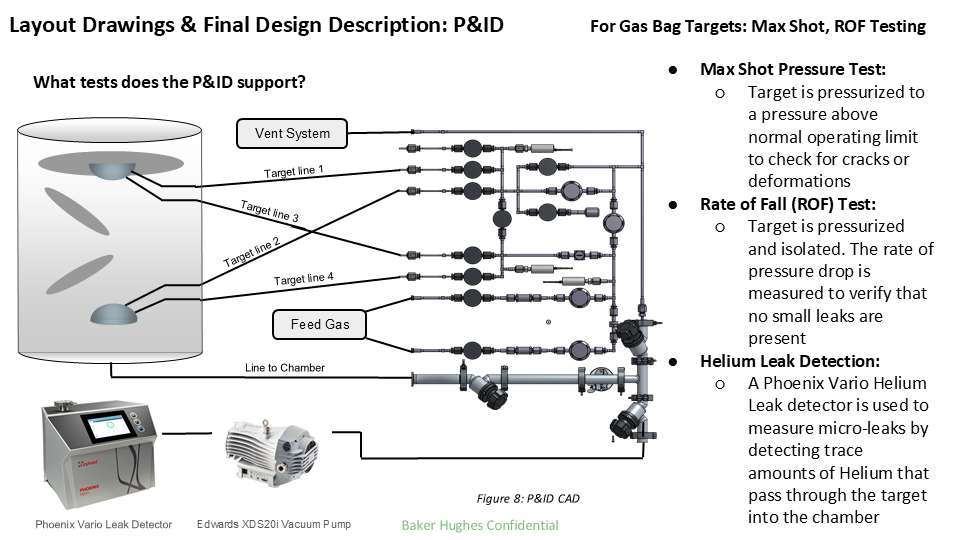
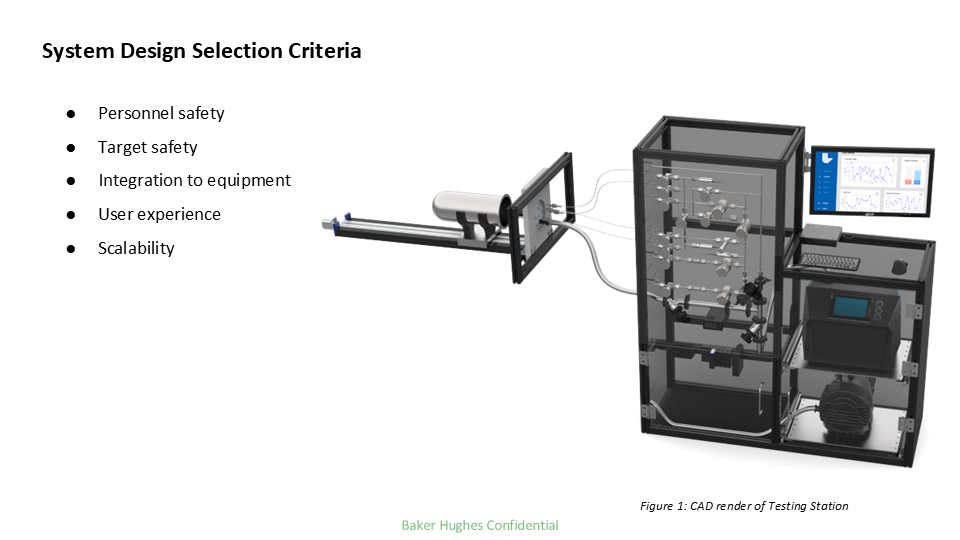
Designed for Lawrence Livermore’s National Ignition Facility, this Target Pressure Testing Station enables reliable validation of fragile, one‑of‑a‑kind targets under extreme conditions. The system integrates vacuum testing, dual leak detection, and real‑time data visualization to ensure experiment‑ready integrity in a high‑stakes fusion environment.
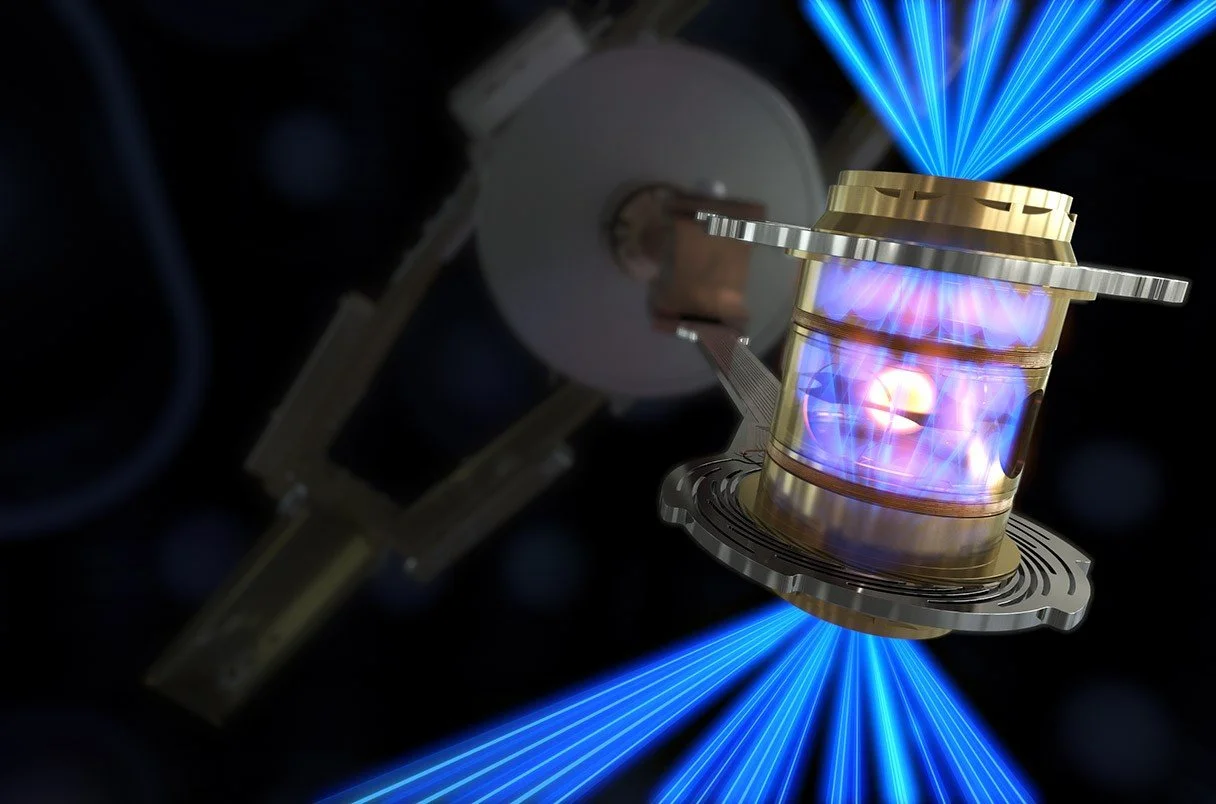
Before fragile, one-of-a-kind targets ever face the world’s most powerful laser at LLNL’s National Ignition Facility, they need to prove they can take the pressure, literally. That’s where our system comes in.
Designed from the ground up, our Target Pressure Testing Station gives LLNL technicians a reliable, user-friendly way to simulate extreme conditions, verify seals, and catch leaks before it’s too late. With dual leak detection methods, a vacuum-sealed chamber, and a custom-built GUI that streams live pressure and temperature data from LabVIEW, the system brings precision and control to a high-stakes environment.
From the GUI to the frame, every part of the design was built with real-world lab workflows in mind. Because when your experiment could change the future of fusion energy, failure isn’t an option.
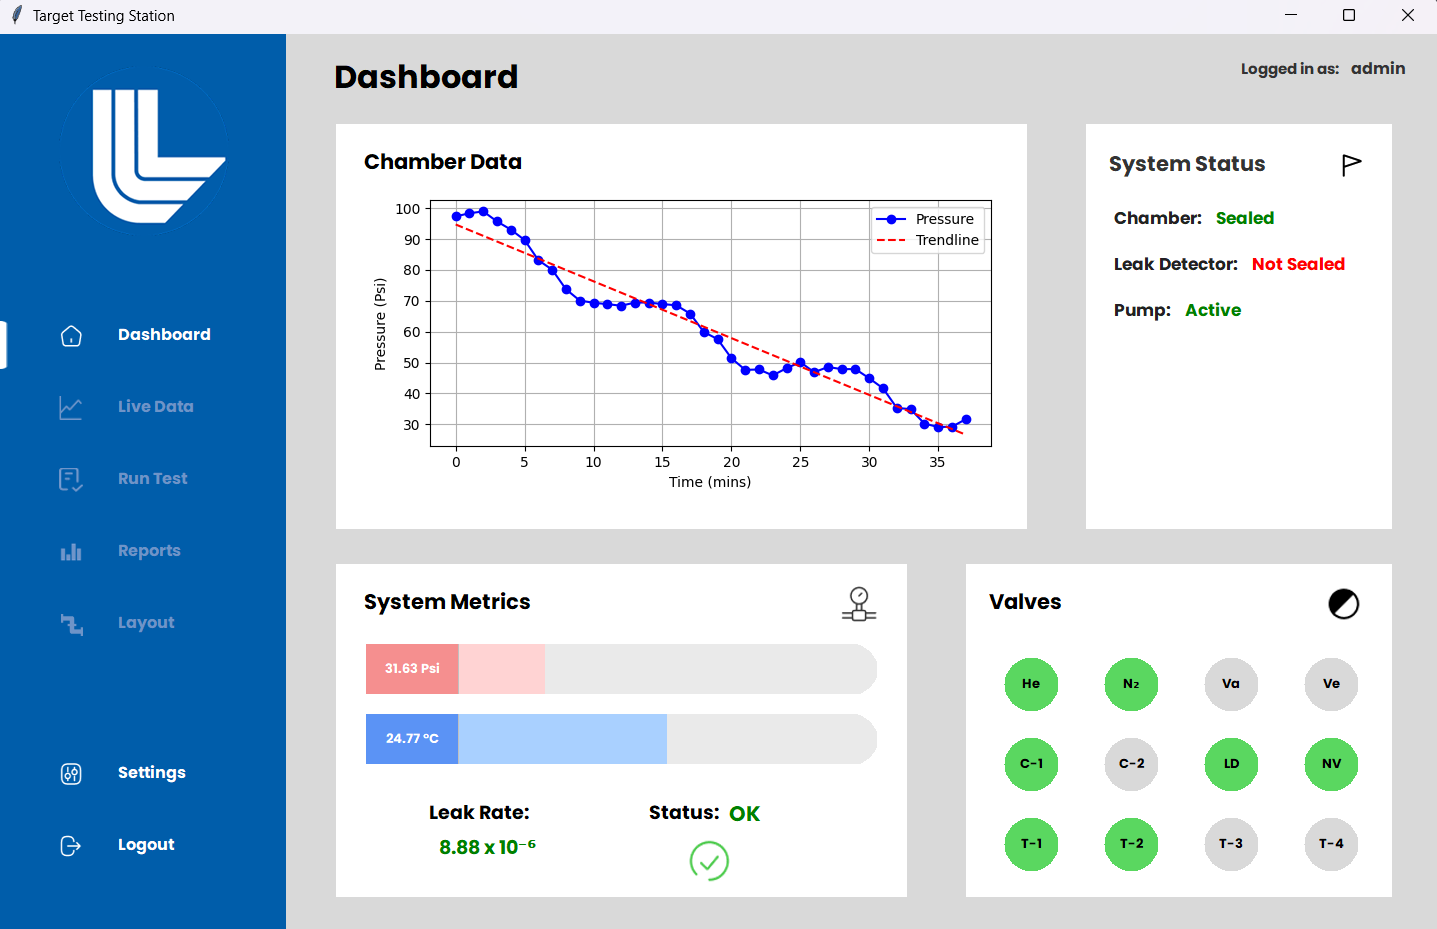
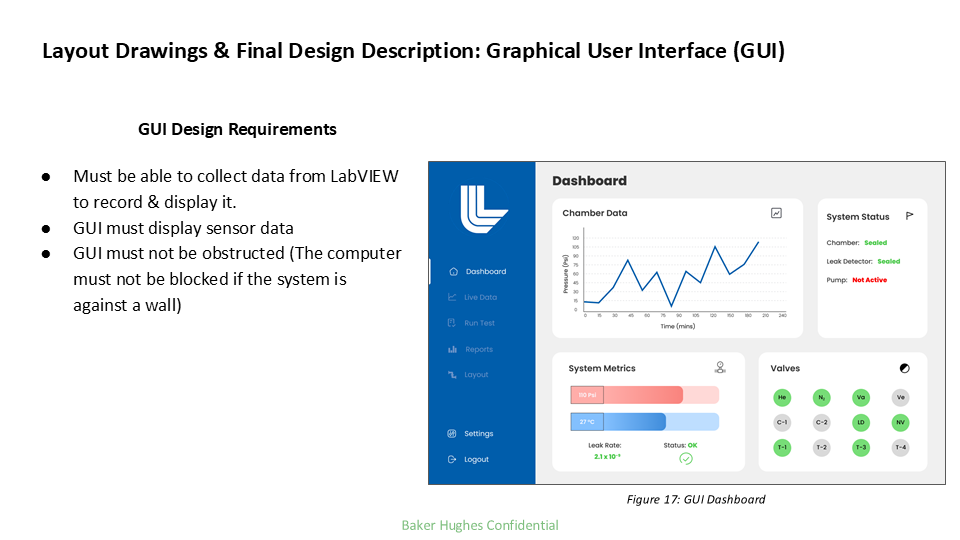
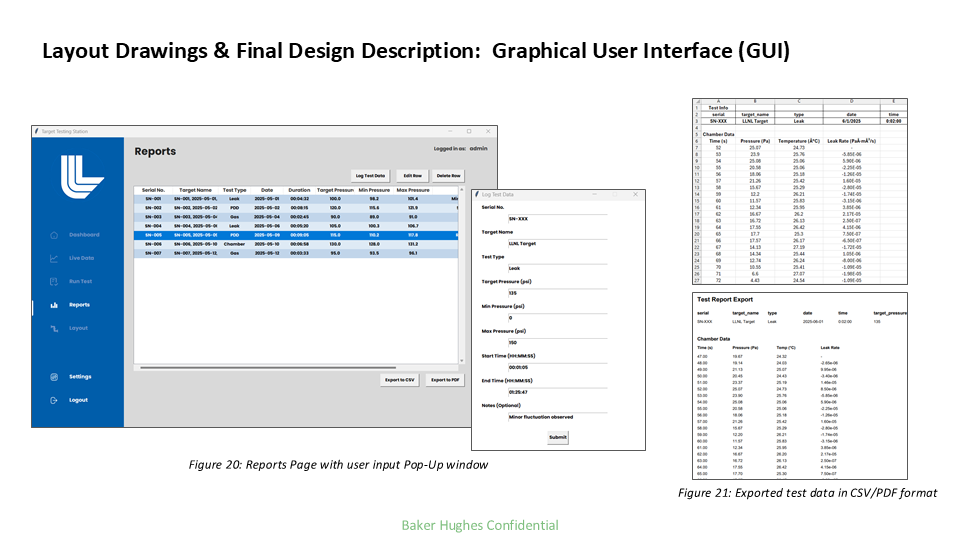
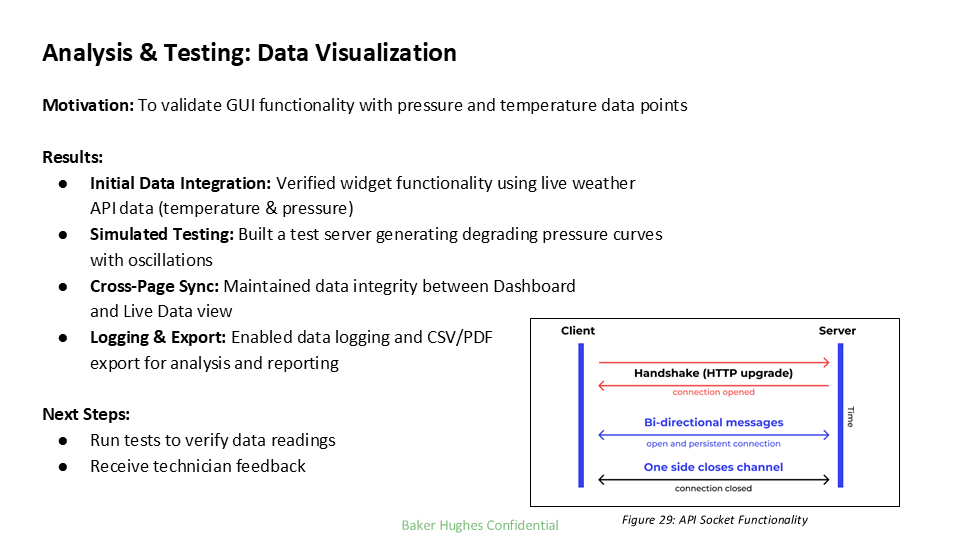
I built the entire Graphical User Interface (GUI) for the Target Pressure Testing Station from the ground up. Written in Python, the GUI connects to LabVIEW via custom TCP/IP sockets, streams real-time pressure and temperature data, and presents it through clean, intuitive visuals. Technicians can start tests, monitor leak rates, log chamber data, and export results — all through a dashboard designed specifically around their workflow. Every element was engineered to be readable, responsive, and reliable under real lab conditions.
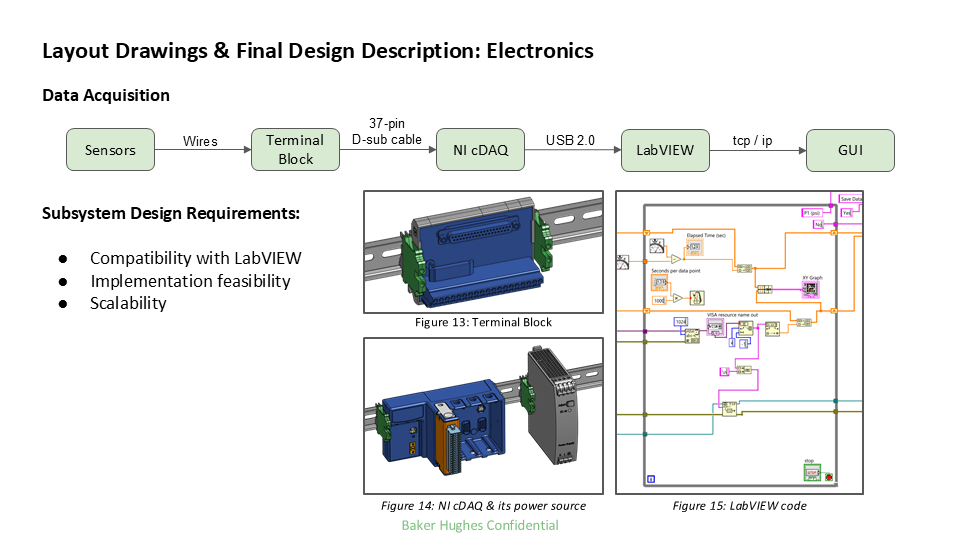
To ensure robustness, I developed a simulated test server that mimicked chamber pressure decay, letting me stress-test the GUI before hardware was even available. I also helped bridge electronics integration, ensuring seamless communication with the DAQ system. In short, I turned raw data into actionable insight — making it easier for LLNL technicians to qualify targets before they’re exposed to the most powerful laser system on Earth.